
Ever spent hours digging through messy spreadsheets trying to find one key insight? Frustrating, right?
But what if you can convert the dirty data into clear, useful insights that help to make smart decisions? This is where Excel comes in!
Excel is not only a place to store numbers - it is a powerful tool for organizing, analyzing, and visualizing data - perfect for students, business professionals, analysts, and anyone who wants to make sense of data without needing advanced software.
So, in this blog, you will go through the basic things of data analysis in Excel - from simple tasks to advanced techniques. By the end, you will be equipped to handle data like a supporter and make informed decisions with confidence!
Let’s hop in and transform how you view data with Excel!
What is Data Analysis in Excel?
Data analysis is the process of examining, cleaning, transforming, and modeling data to extract useful insights and support decision-making for businesses. Excel provides a user-friendly interface and numerous tools that allow users to manage data easily.
Whether you’re a student, business professional, or researcher, mastering data analysis in Excel can help you improve your efficiency and make informed decisions. By using Excel’s advanced features, you can easily analyze datasets, detect trends, and present insights effectively.
Why is Excel an Ideal Choice for Data Analysis?
Microsoft Excel is a flexible and easy-to-use tool for data analysis because:
- It provides a simple platform that simplifies data management for all users.
- It offers various features to examine, clean, transform, and model data effectively.
- Mastering Excel improves productivity, making data analysis faster and easier.
- Excel helps users extract insights and present them clearly to inform decisions.
- Tools like trend detection and dataset analysis enable deeper insights.
Now, that we know what Data Analysis in Excel means and why it is the ideal choice, let's learn the art of preparing Data in Excel.
Preparing Data for Analysis in Excel
We all know that Excel is a popular & user-friendly tool for analyzing and visualizing data and has a variety of tools & functions for doing simple and complex data analysis tasks. But before diving into analysis, you need clean, well-structured data. Here’s how to prepare it:
Getting Your Dataset Ready
To ensure accuracy, your dataset must be cleaned and organized before proceeding with the study.
How To Clean Data in Excel?
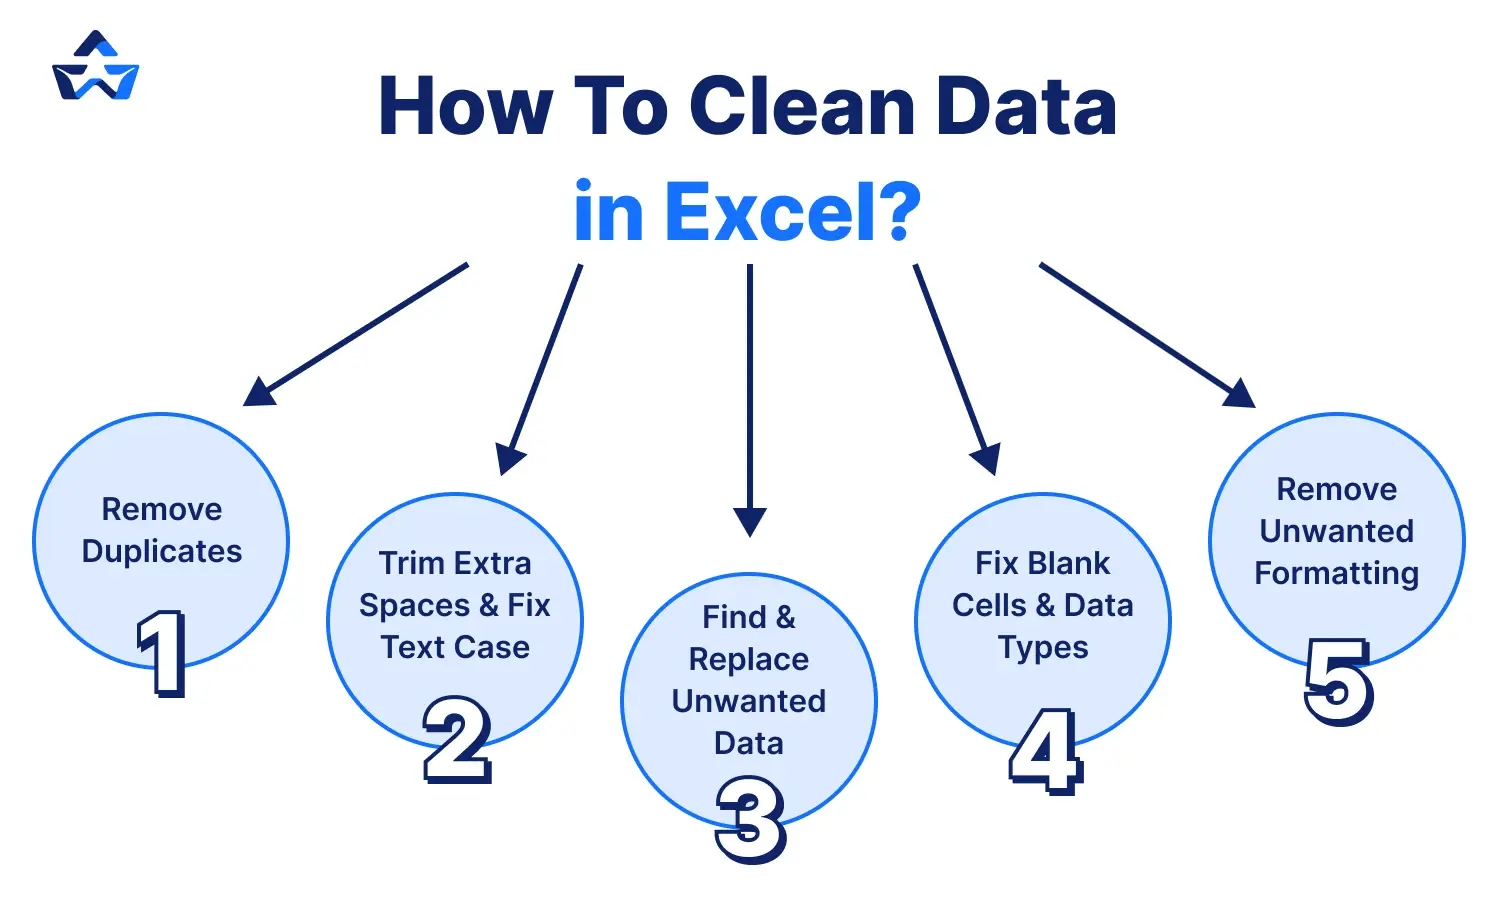
1. Remove Duplicates
- Select your data.
Go to Data → Remove Duplicates → Select columns → Click OK.
2. Trim Extra Spaces & Fix Text Case
- To Remove Extra Spaces- Use =TRIM(A1)
- Convert text case:
- =UPPER(A1) (UPPERCASE)
- =LOWER(A1) (lowercase)
- =PROPER(A1) (Title Case)
3. Find & Replace Unwanted Data
- Press Ctrl + H → Enter the text/character to replace → Click Replace All.
4. Fix Blank Cells & Data Types
- Select blank cells (Ctrl + G → Special → Blanks) and fill as needed.
- Use Text to Columns (Data → Text to Columns) to correct number or date formats.
5. Remove Unwanted Formatting
- Select the data.
- Click Clear Formats (Home → Editing → Clear → Clear Formats).
So, these
Basic Approaches for Data Analysis in Excel
For beginners, Excel provides several basic tools and functions that make data analysis simple and efficient:
- Sorting Data
Sorting is one of the easiest methods for analyzing data in Excel. You can sort data in ascending or descending order using one or more columns. Sorting data allows you to analyze and interpret your data quickly, organize and discover the information you want, and ultimately help you make better decisions. Sorting can be done using either columns or rows. This allows you to quickly identify trends and patterns.
- Filtering Data
In data analysis in Excel, you can use filtering to extract information from a specific range or table that meets the given requirements. This is a quick approach to displaying only the info you need. Data in a Range, Table, or Pivot Table can be filtered.
You can use Selected Values to filter data. You can edit your filtering preferences in the Custom AutoFilter dialogue box, which appears when you select a Filter option or the Custom Filter link at the bottom of the list of Filter choices.
- Conditional Formatting
Conditional formatting can help you see patterns and trends in your data by highlighting it. To use it in Data Analysis Excel, create rules that define cell format based on their values. Conditional formatting in Excel for Windows can be used on a collection of cells, an Excel table, or even a Pivot Table report.
- Charts and visualizations
A chart can be used to show any collection of information. A chart is a visual representation of data that uses symbols, such as bars in a bar chart or lines in a line chart. Data analysis Excel has numerous different chart styles for you to select from, or you can use the Excel Recommended Charts option to view charts designed particularly for your data and select one of them.
Advanced Data Analysis Tools Used in Excel
Once you're comfortable with basic Excel data analysis, you can explore advanced tools to work smarter. Excel offers some powerful tools that make data analysis easier like Power BI, Power Query, and many more. Here are some of the tools that you can use:
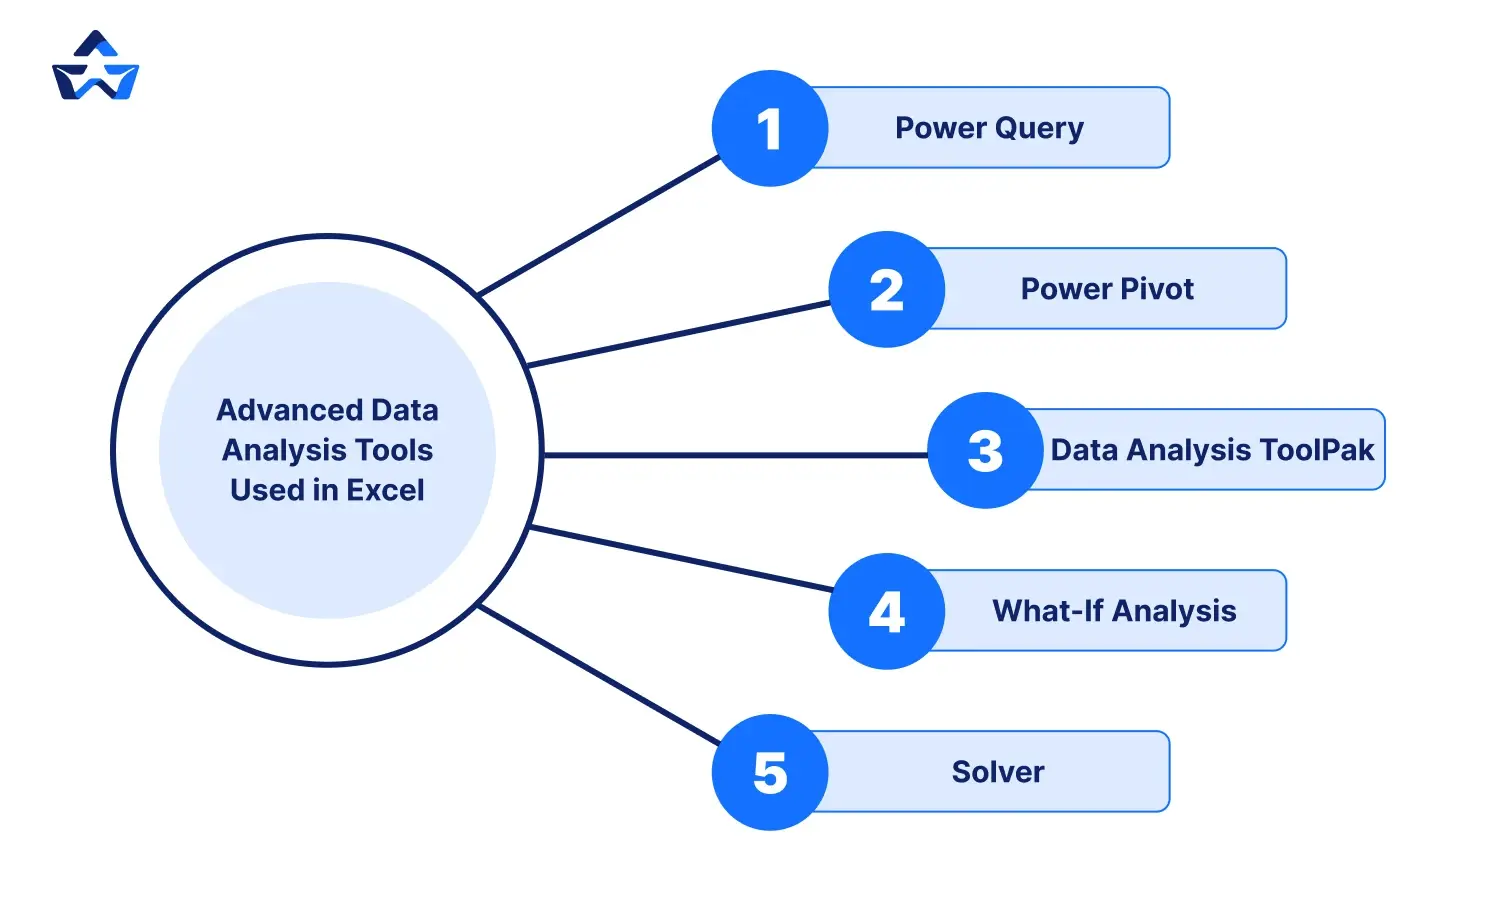
- Power Query
Power Query is a tool that helps you to clean and transform data quickly. You can easily import data from different sources, merge tables, remove duplicates, and automate repetitive tasks. It is useful for handling large datasets and preparing data before analysis.
- Power Pivot
Power Pivot allows you to create complex data models with relationships between different tables. It allows you to perform advanced calculations, manage large amounts of data, and create more detailed Pivot Tables. This tool is especially useful for financial analysis and business intelligence.
- Data Analysis ToolPak
The Data Analysis ToolPak is an Excel add-in that provides advanced statistical tools such as regression analysis, moving averages, histograms, and variance tests. It is useful for conducting in-depth data analysis without needing external software.
- What-If Analysis
What-if analysis allows users to test different scenarios and see how changes in variables affect the final outcome. It includes:
- Scenario Manager: Compares different sets of input values and their impact on results.
- Goal Seek: It helps you to find the required input value to reach a specific result.
- Data Tables: Analyze the effect of changing multiple variables in a formula.
- Solver
A solver is an optimization tool that helps find the best possible solution for a problem by changing multiple variables. It is useful for financial modeling, scheduling, and supply chain management.
Important Excel Functions for Data Analysis
Excel has many built-in functions that simplify data analysis by allowing quick calculations and summaries. Some of the most important ones include:
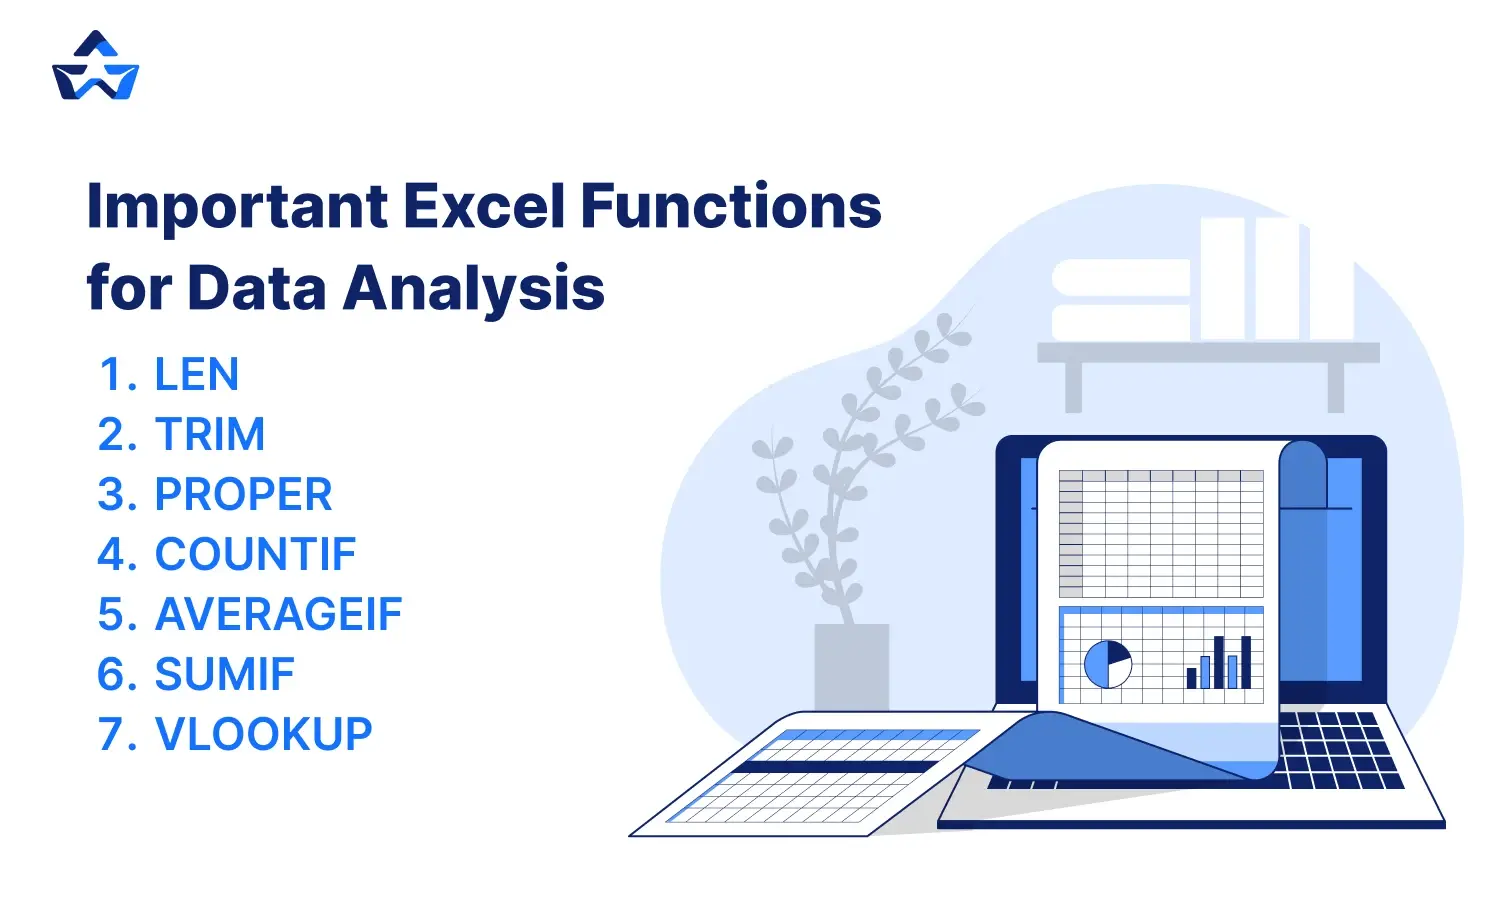
- LEN
The LEN function quickly returns the number of characters in a given cell. The =LEN formula can be used to calculate the number of characters is required in a cell to differentiate between two separate types of product Stock Keeping Units. When trying to differentiate between separate Unique Identifiers, which can often be long and out of order, thus, LEN is critical.
- =LEN(Select Cell)
- TRIM
The =TRIM function removes all spaces from a cell while maintaining single spaces between words. The primary use of this function is to remove trailing spaces. It is typical for those users who are used to insert spaces at the end of text or to copy material verbatim from another source.
- =TRIM(Select Cell)
- PROPER
The PROPER Function is included under the Excel Text Functions section. PROPER will capitalize any following letters of text that follow a non-letter character.
- =PROPER(Text)
Text (required parameter): Any formula that returns text, a cell reference, or text in quote marks must include the text you want to partially capitalize.
The PROPER function converts the first letter of each word, letters after numbers, and other punctuation to uppercase. It might appear in the most unexpected places. The characters for numerals and punctuation are unchanged.
- COUNTIF
Excel includes a built-in function called COUNTIF that counts the specified cells. The COUNTIF function in Excel can be used for both simple and complex data analysis. This covers the fundamentals of counting specific numbers and words.
- =COUNTIF(range,criteria)
Range: The size of the cell range that will be counted.
Criteria: The standards used to choose cells for counting.
- AVERAGEIF
An Excel built-in tool called AVERAGEIF calculates the average of a range based on a true or false condition.
- = AVERAGEIF(range, criteria, [average_range]).
Range: The size of the cell range that will be counted.
Criteria: The standards used to choose cells for counting.
The average range refers to the range over which the function computes the average. However, the average range is not needed.
- SUMIF
SUMIF, an Excel built-in function that checks if a condition is true or false before adding data in a range.
- = SUMIF(range, criteria, [sum_range]).
Range: The size of the cell range that will be counted.
Criteria: The standards used to choose cells for counting.
The sum range refers to the range of values used by the function to calculate the total.
- VLOOKUP
The built-in Excel function VLOOKUP allows you to search across several columns.
- = VLOOKUP (lookup_value, table_array, col_index_num, [range_lookup])
Lookup_value: Select the cell that will contain the search criteria.
Table_array: The whole table range, including each individual cell.
Col_index_num: The information that is being searched for. The input is the number in the column, beginning at the left.
Range_lookup: FALSE if text is 0 and TRUE if numbers are 1.
- Pivot Table
A pivot table is a statistics tool that condenses and reorganizes selected columns and rows of data in a spreadsheet or database to produce reports. Instead of modifying the spreadsheet or database, the application merely "pivots" or rotates the data to analyze it from different perspectives.
Unlock the Power of Data! Enhance your Excel skills and become a data analysis pro with expert tips from Bosscoder Academy.
Conclusion
Mastering data analysis in Excel can change the way you work with data, making it simpler to see trends, make decisions, and exchange insights. Charts, conditional formatting, and sophisticated functions can help you go through and analyze datasets more efficiently.
Make use of Excel's wide tools and functions, which include Data Analysis Excel tools like Pivot Tables, to improve your data presentation. Dive in and learn how Excel can help you extract useful insights from your data.
FAQs
Q1. What is data analysis in Excel?
Answer: Data analysis in Excel is the process of examining, cleaning, transforming, and modeling data to extract useful insights and support decision-making for businesses. Excel provides a user-friendly interface and numerous tools that allow users to manage data efficiently without requiring advanced software.
Q2. What are the basic methods for data analysis in Excel?
Answer: Basic methods for data analysis in Excel include sorting data in ascending or descending order to identify trends, filtering data to extract specific information, using conditional formatting to highlight patterns and trends, and creating charts and visualizations to represent data graphically.
Q3. What is the COUNTIF function used for in Excel?
Answer: The COUNTIF function in Excel counts cells that meet a specified criterion within a range. The syntax is =COUNTIF(range, criteria), where "range" is the cell range to be counted and "criteria" are the standards used to select cells for counting. It's useful for both simple and complex data analysis tasks.
Q4. How do I use Pivot Tables for data analysis?
Answer: A Pivot Table is a statistics tool that condenses and reorganizes selected columns and rows of data to produce reports. It allows you to analyze data from different perspectives without modifying the original dataset. Pivot Tables help summarize large datasets and deliver dynamic insights through customizable cross-tabulations.
Q5. What is the VLOOKUP function, and how is it used in data analysis?
Answer: VLOOKUP is a function that allows you to search across multiple columns. The syntax is =VLOOKUP(lookup_value, table_array, col_index_num, [range_lookup]), where "lookup_value" is your search criteria, "table_array" is the range of cells being searched, "col_index_num" is the column number containing the return value, and "range_lookup" determines whether to find an approximate match.
Q6. What is the difference between SUMIF and AVERAGEIF functions?
Answer: SUMIF adds values in a range that meet a specified condition. Its syntax is =SUMIF(range, criteria, [sum_range]). AVERAGEIF calculates the average of values in a range that meet a specified condition. Its syntax is =AVERAGEIF(range, criteria, [average_range]). Both functions are valuable for conditional calculations in data analysis.
Ever spent hours digging through messy spreadsheets trying to find one key insight? Frustrating, right?
But what if you can convert the dirty data into clear, useful insights that help to make smart decisions? This is where Excel comes in!
Excel is not only a place to store numbers - it is a powerful tool for organizing, analyzing, and visualizing data - perfect for students, business professionals, analysts, and anyone who wants to make sense of data without needing advanced software.
So, in this blog, you will go through the basic things of data analysis in Excel - from simple tasks to advanced techniques. By the end, you will be equipped to handle data like a supporter and make informed decisions with confidence!
Let’s hop in and transform how you view data with Excel!
What is Data Analysis in Excel?
Data analysis is the process of examining, cleaning, transforming, and modeling data to extract useful insights and support decision-making for businesses. Excel provides a user-friendly interface and numerous tools that allow users to manage data easily.
Whether you’re a student, business professional, or researcher, mastering data analysis in Excel can help you improve your efficiency and make informed decisions. By using Excel’s advanced features, you can easily analyze datasets, detect trends, and present insights effectively.
Why is Excel an Ideal Choice for Data Analysis?
Microsoft Excel is a flexible and easy-to-use tool for data analysis because:
- It provides a simple platform that simplifies data management for all users.
- It offers various features to examine, clean, transform, and model data effectively.
- Mastering Excel improves productivity, making data analysis faster and easier.
- Excel helps users extract insights and present them clearly to inform decisions.
- Tools like trend detection and dataset analysis enable deeper insights.
Now, that we know what Data Analysis in Excel means and why it is the ideal choice, let's learn the art of preparing Data in Excel.
Preparing Data for Analysis in Excel
We all know that Excel is a popular & user-friendly tool for analyzing and visualizing data and has a variety of tools & functions for doing simple and complex data analysis tasks. But before diving into analysis, you need clean, well-structured data. Here’s how to prepare it:
Getting Your Dataset Ready
To ensure accuracy, your dataset must be cleaned and organized before proceeding with the study.
How To Clean Data in Excel?
1. Remove Duplicates
- Select your data.
Go to Data → Remove Duplicates → Select columns → Click OK.
2. Trim Extra Spaces & Fix Text Case
- To Remove Extra Spaces- Use =TRIM(A1)
- Convert text case:
- =UPPER(A1) (UPPERCASE)
- =LOWER(A1) (lowercase)
- =PROPER(A1) (Title Case)
3. Find & Replace Unwanted Data
- Press Ctrl + H → Enter the text/character to replace → Click Replace All.
4. Fix Blank Cells & Data Types
- Select blank cells (Ctrl + G → Special → Blanks) and fill as needed.
- Use Text to Columns (Data → Text to Columns) to correct number or date formats.
5. Remove Unwanted Formatting
- Select the data.
- Click Clear Formats (Home → Editing → Clear → Clear Formats).
So, these
Basic Approaches for Data Analysis in Excel
For beginners, Excel provides several basic tools and functions that make data analysis simple and efficient:
- Sorting Data
Sorting is one of the easiest methods for analyzing data in Excel. You can sort data in ascending or descending order using one or more columns. Sorting data allows you to analyze and interpret your data quickly, organize and discover the information you want, and ultimately help you make better decisions. Sorting can be done using either columns or rows. This allows you to quickly identify trends and patterns.
- Filtering Data
In data analysis in Excel, you can use filtering to extract information from a specific range or table that meets the given requirements. This is a quick approach to displaying only the info you need. Data in a Range, Table, or Pivot Table can be filtered.
You can use Selected Values to filter data. You can edit your filtering preferences in the Custom AutoFilter dialogue box, which appears when you select a Filter option or the Custom Filter link at the bottom of the list of Filter choices.
- Conditional Formatting
Conditional formatting can help you see patterns and trends in your data by highlighting it. To use it in Data Analysis Excel, create rules that define cell format based on their values. Conditional formatting in Excel for Windows can be used on a collection of cells, an Excel table, or even a Pivot Table report.
- Charts and visualizations
A chart can be used to show any collection of information. A chart is a visual representation of data that uses symbols, such as bars in a bar chart or lines in a line chart. Data analysis Excel has numerous different chart styles for you to select from, or you can use the Excel Recommended Charts option to view charts designed particularly for your data and select one of them.
Advanced Data Analysis Tools Used in Excel
Once you're comfortable with basic Excel data analysis, you can explore advanced tools to work smarter. Excel offers some powerful tools that make data analysis easier like Power BI, Power Query, and many more. Here are some of the tools that you can use:
- Power Query
Power Query is a tool that helps you to clean and transform data quickly. You can easily import data from different sources, merge tables, remove duplicates, and automate repetitive tasks. It is useful for handling large datasets and preparing data before analysis.
- Power Pivot
Power Pivot allows you to create complex data models with relationships between different tables. It allows you to perform advanced calculations, manage large amounts of data, and create more detailed Pivot Tables. This tool is especially useful for financial analysis and business intelligence.
- Data Analysis ToolPak
The Data Analysis ToolPak is an Excel add-in that provides advanced statistical tools such as regression analysis, moving averages, histograms, and variance tests. It is useful for conducting in-depth data analysis without needing external software.
- What-If Analysis
What-if analysis allows users to test different scenarios and see how changes in variables affect the final outcome. It includes:
- Scenario Manager: Compares different sets of input values and their impact on results.
- Goal Seek: It helps you to find the required input value to reach a specific result.
- Data Tables: Analyze the effect of changing multiple variables in a formula.
- Solver
A solver is an optimization tool that helps find the best possible solution for a problem by changing multiple variables. It is useful for financial modeling, scheduling, and supply chain management.
Important Excel Functions for Data Analysis
Excel has many built-in functions that simplify data analysis by allowing quick calculations and summaries. Some of the most important ones include:
- LEN
The LEN function quickly returns the number of characters in a given cell. The =LEN formula can be used to calculate the number of characters is required in a cell to differentiate between two separate types of product Stock Keeping Units. When trying to differentiate between separate Unique Identifiers, which can often be long and out of order, thus, LEN is critical.
- =LEN(Select Cell)
- TRIM
The =TRIM function removes all spaces from a cell while maintaining single spaces between words. The primary use of this function is to remove trailing spaces. It is typical for those users who are used to insert spaces at the end of text or to copy material verbatim from another source.
- =TRIM(Select Cell)
- PROPER
The PROPER Function is included under the Excel Text Functions section. PROPER will capitalize any following letters of text that follow a non-letter character.
- =PROPER(Text)
Text (required parameter): Any formula that returns text, a cell reference, or text in quote marks must include the text you want to partially capitalize.
The PROPER function converts the first letter of each word, letters after numbers, and other punctuation to uppercase. It might appear in the most unexpected places. The characters for numerals and punctuation are unchanged.
- COUNTIF
Excel includes a built-in function called COUNTIF that counts the specified cells. The COUNTIF function in Excel can be used for both simple and complex data analysis. This covers the fundamentals of counting specific numbers and words.
- =COUNTIF(range,criteria)
Range: The size of the cell range that will be counted.
Criteria: The standards used to choose cells for counting.
- AVERAGEIF
An Excel built-in tool called AVERAGEIF calculates the average of a range based on a true or false condition.
- = AVERAGEIF(range, criteria, [average_range]).
Range: The size of the cell range that will be counted.
Criteria: The standards used to choose cells for counting.
The average range refers to the range over which the function computes the average. However, the average range is not needed.
- SUMIF
SUMIF, an Excel built-in function that checks if a condition is true or false before adding data in a range.
- = SUMIF(range, criteria, [sum_range]).
Range: The size of the cell range that will be counted.
Criteria: The standards used to choose cells for counting.
The sum range refers to the range of values used by the function to calculate the total.
- VLOOKUP
The built-in Excel function VLOOKUP allows you to search across several columns.
- = VLOOKUP (lookup_value, table_array, col_index_num, [range_lookup])
Lookup_value: Select the cell that will contain the search criteria.
Table_array: The whole table range, including each individual cell.
Col_index_num: The information that is being searched for. The input is the number in the column, beginning at the left.
Range_lookup: FALSE if text is 0 and TRUE if numbers are 1.
- Pivot Table
A pivot table is a statistics tool that condenses and reorganizes selected columns and rows of data in a spreadsheet or database to produce reports. Instead of modifying the spreadsheet or database, the application merely "pivots" or rotates the data to analyze it from different perspectives.
Unlock the Power of Data! Enhance your Excel skills and become a data analysis pro with expert tips from Bosscoder Academy.
Conclusion
Mastering data analysis in Excel can change the way you work with data, making it simpler to see trends, make decisions, and exchange insights. Charts, conditional formatting, and sophisticated functions can help you go through and analyze datasets more efficiently.
Make use of Excel's wide tools and functions, which include Data Analysis Excel tools like Pivot Tables, to improve your data presentation. Dive in and learn how Excel can help you extract useful insights from your data.
FAQs
Q1. What is data analysis in Excel?
Answer: Data analysis in Excel is the process of examining, cleaning, transforming, and modeling data to extract useful insights and support decision-making for businesses. Excel provides a user-friendly interface and numerous tools that allow users to manage data efficiently without requiring advanced software.
Q2. What are the basic methods for data analysis in Excel?
Answer: Basic methods for data analysis in Excel include sorting data in ascending or descending order to identify trends, filtering data to extract specific information, using conditional formatting to highlight patterns and trends, and creating charts and visualizations to represent data graphically.
Q3. What is the COUNTIF function used for in Excel?
Answer: The COUNTIF function in Excel counts cells that meet a specified criterion within a range. The syntax is =COUNTIF(range, criteria), where "range" is the cell range to be counted and "criteria" are the standards used to select cells for counting. It's useful for both simple and complex data analysis tasks.
Q4. How do I use Pivot Tables for data analysis?
Answer: A Pivot Table is a statistics tool that condenses and reorganizes selected columns and rows of data to produce reports. It allows you to analyze data from different perspectives without modifying the original dataset. Pivot Tables help summarize large datasets and deliver dynamic insights through customizable cross-tabulations.
Q5. What is the VLOOKUP function, and how is it used in data analysis?
Answer: VLOOKUP is a function that allows you to search across multiple columns. The syntax is =VLOOKUP(lookup_value, table_array, col_index_num, [range_lookup]), where "lookup_value" is your search criteria, "table_array" is the range of cells being searched, "col_index_num" is the column number containing the return value, and "range_lookup" determines whether to find an approximate match.
Q6. What is the difference between SUMIF and AVERAGEIF functions?
Answer: SUMIF adds values in a range that meet a specified condition. Its syntax is =SUMIF(range, criteria, [sum_range]). AVERAGEIF calculates the average of values in a range that meet a specified condition. Its syntax is =AVERAGEIF(range, criteria, [average_range]). Both functions are valuable for conditional calculations in data analysis.
Ever spent hours digging through messy spreadsheets trying to find one key insight? Frustrating, right?
But what if you can convert the dirty data into clear, useful insights that help to make smart decisions? This is where Excel comes in!
Excel is not only a place to store numbers - it is a powerful tool for organizing, analyzing, and visualizing data - perfect for students, business professionals, analysts, and anyone who wants to make sense of data without needing advanced software.
So, in this blog, you will go through the basic things of data analysis in Excel - from simple tasks to advanced techniques. By the end, you will be equipped to handle data like a supporter and make informed decisions with confidence!
Let’s hop in and transform how you view data with Excel!
What is Data Analysis in Excel?
Data analysis is the process of examining, cleaning, transforming, and modeling data to extract useful insights and support decision-making for businesses. Excel provides a user-friendly interface and numerous tools that allow users to manage data easily.
Whether you’re a student, business professional, or researcher, mastering data analysis in Excel can help you improve your efficiency and make informed decisions. By using Excel’s advanced features, you can easily analyze datasets, detect trends, and present insights effectively.
Why is Excel an Ideal Choice for Data Analysis?
Microsoft Excel is a flexible and easy-to-use tool for data analysis because:
- It provides a simple platform that simplifies data management for all users.
- It offers various features to examine, clean, transform, and model data effectively.
- Mastering Excel improves productivity, making data analysis faster and easier.
- Excel helps users extract insights and present them clearly to inform decisions.
- Tools like trend detection and dataset analysis enable deeper insights.
Now, that we know what Data Analysis in Excel means and why it is the ideal choice, let's learn the art of preparing Data in Excel.
Preparing Data for Analysis in Excel
We all know that Excel is a popular & user-friendly tool for analyzing and visualizing data and has a variety of tools & functions for doing simple and complex data analysis tasks. But before diving into analysis, you need clean, well-structured data. Here’s how to prepare it:
Getting Your Dataset Ready
To ensure accuracy, your dataset must be cleaned and organized before proceeding with the study.
How To Clean Data in Excel?
1. Remove Duplicates
- Select your data.
Go to Data → Remove Duplicates → Select columns → Click OK.
2. Trim Extra Spaces & Fix Text Case
- To Remove Extra Spaces- Use =TRIM(A1)
- Convert text case:
- =UPPER(A1) (UPPERCASE)
- =LOWER(A1) (lowercase)
- =PROPER(A1) (Title Case)
3. Find & Replace Unwanted Data
- Press Ctrl + H → Enter the text/character to replace → Click Replace All.
4. Fix Blank Cells & Data Types
- Select blank cells (Ctrl + G → Special → Blanks) and fill as needed.
- Use Text to Columns (Data → Text to Columns) to correct number or date formats.
5. Remove Unwanted Formatting
- Select the data.
- Click Clear Formats (Home → Editing → Clear → Clear Formats).
Once your data is clean, it’s ready for analysis. Let’s explore some core techniques Excel offers.
Basic Approaches for Data Analysis in Excel
For beginners, Excel provides several basic tools and functions that make data analysis simple and efficient:
- Sorting Data
Sorting is one of the easiest methods for analyzing data in Excel. You can sort data in ascending or descending order using one or more columns. Sorting data allows you to analyze and interpret your data quickly, organize and discover the information you want, and ultimately help you make better decisions. Sorting can be done using either columns or rows. This allows you to quickly identify trends and patterns.
- Filtering Data
In data analysis in Excel, you can use filtering to extract information from a specific range or table that meets the given requirements. This is a quick approach to displaying only the info you need. Data in a Range, Table, or Pivot Table can be filtered.
You can use Selected Values to filter data. You can edit your filtering preferences in the Custom AutoFilter dialogue box, which appears when you select a Filter option or the Custom Filter link at the bottom of the list of Filter choices.
- Conditional Formatting
Conditional formatting can help you see patterns and trends in your data by highlighting it. To use it in Data Analysis Excel, create rules that define cell format based on their values. Conditional formatting in Excel for Windows can be used on a collection of cells, an Excel table, or even a Pivot Table report.
- Charts and visualizations
A chart can be used to show any collection of information. A chart is a visual representation of data that uses symbols, such as bars in a bar chart or lines in a line chart. Data analysis Excel has numerous different chart styles for you to select from, or you can use the Excel Recommended Charts option to view charts designed particularly for your data and select one of them.
Advanced Data Analysis Tools Used in Excel
Once you're comfortable with basic Excel data analysis, you can explore advanced tools to work smarter. Excel offers some powerful tools that make data analysis easier like Power BI, Power Query, and many more. Here are some of the tools that you can use:
- Power Query
Power Query is a tool that helps you to clean and transform data quickly. You can easily import data from different sources, merge tables, remove duplicates, and automate repetitive tasks. It is useful for handling large datasets and preparing data before analysis.
- Power Pivot
Power Pivot allows you to create complex data models with relationships between different tables. It allows you to perform advanced calculations, manage large amounts of data, and create more detailed Pivot Tables. This tool is especially useful for financial analysis and business intelligence.
- Data Analysis ToolPak
The Data Analysis ToolPak is an Excel add-in that provides advanced statistical tools such as regression analysis, moving averages, histograms, and variance tests. It is useful for conducting in-depth data analysis without needing external software.
- What-If Analysis
What-if analysis allows users to test different scenarios and see how changes in variables affect the final outcome. It includes:
- Scenario Manager: Compares different sets of input values and their impact on results.
- Goal Seek: It helps you to find the required input value to reach a specific result.
- Data Tables: Analyze the effect of changing multiple variables in a formula.
- Solver
A solver is an optimization tool that helps find the best possible solution for a problem by changing multiple variables. It is useful for financial modeling, scheduling, and supply chain management.
Important Excel Functions for Data Analysis
Excel has many built-in functions that simplify data analysis by allowing quick calculations and summaries. Some of the most important ones include:
- LEN
The LEN function quickly returns the number of characters in a given cell. The =LEN formula can be used to calculate the number of characters is required in a cell to differentiate between two separate types of product Stock Keeping Units. When trying to differentiate between separate Unique Identifiers, which can often be long and out of order, thus, LEN is critical.
=LEN(Select Cell)
- TRIM
The =TRIM function removes all spaces from a cell while maintaining single spaces between words. The primary use of this function is to remove trailing spaces. It is typical for those users who are used to insert spaces at the end of text or to copy material verbatim from another source.
=TRIM(Select Cell)
- PROPER
The PROPER Function is included under the Excel Text Functions section. PROPER will capitalize any following letters of text that follow a non-letter character.
=PROPER(Text)
Text (required parameter): Any formula that returns text, a cell reference, or text in quote marks must include the text you want to partially capitalize.
The PROPER function converts the first letter of each word, letters after numbers, and other punctuation to uppercase. It might appear in the most unexpected places. The characters for numerals and punctuation are unchanged.
- COUNTIF
Excel includes a built-in function called COUNTIF that counts the specified cells. The COUNTIF function in Excel can be used for both simple and complex data analysis. This covers the fundamentals of counting specific numbers and words.
=COUNTIF(range,criteria)
Range: The size of the cell range that will be counted.
Criteria: The standards used to choose cells for counting.
- AVERAGEIF
An Excel built-in tool called AVERAGEIF calculates the average of a range based on a true or false condition.
= AVERAGEIF(range, criteria, [average_range]).
Range: The size of the cell range that will be counted.
Criteria: The standards used to choose cells for counting.
The average range refers to the range over which the function computes the average. However, the average range is not needed.
- SUMIF
SUMIF, an Excel built-in function that checks if a condition is true or false before adding data in a range.
= SUMIF(range, criteria, [sum_range])
Range: The size of the cell range that will be counted.
Criteria: The standards used to choose cells for counting.
The sum range refers to the range of values used by the function to calculate the total.
- VLOOKUP
The built-in Excel function VLOOKUP allows you to search across several columns.
= VLOOKUP (lookup_value, table_array, col_index_num, [range_lookup])
Lookup_value: Select the cell that will contain the search criteria.
Table_array: The whole table range, including each individual cell.
Col_index_num: The information that is being searched for. The input is the number in the column, beginning at the left.
Range_lookup: FALSE if text is 0 and TRUE if numbers are 1.
- Pivot Table
A pivot table is a statistics tool that condenses and reorganizes selected columns and rows of data in a spreadsheet or database to produce reports. Instead of modifying the spreadsheet or database, the application merely "pivots" or rotates the data to analyze it from different perspectives.
Unlock the Power of Data! Enhance your Excel skills and become a data analysis pro with expert tips from Bosscoder Academy.
Conclusion
Mastering data analysis in Excel can change the way you work with data, making it simpler to see trends, make decisions, and exchange insights. Charts, conditional formatting, and sophisticated functions can help you go through and analyze datasets more efficiently.
Make use of Excel's wide tools and functions, which include Data Analysis Excel tools like Pivot Tables, to improve your data presentation. Dive in and learn how Excel can help you extract useful insights from your data.
FAQs
Q1. What is data analysis in Excel?
Answer: Data analysis in Excel is the process of examining, cleaning, transforming, and modeling data to extract useful insights and support decision-making for businesses. Excel provides a user-friendly interface and numerous tools that allow users to manage data efficiently without requiring advanced software.
Q2. What are the basic methods for data analysis in Excel?
Answer: Basic methods for data analysis in Excel include sorting data in ascending or descending order to identify trends, filtering data to extract specific information, using conditional formatting to highlight patterns and trends, and creating charts and visualizations to represent data graphically.
Q3. What is the COUNTIF function used for in Excel?
Answer: The COUNTIF function in Excel counts cells that meet a specified criterion within a range. The syntax is =COUNTIF(range, criteria), where "range" is the cell range to be counted and "criteria" are the standards used to select cells for counting. It's useful for both simple and complex data analysis tasks.
Q4. How do I use Pivot Tables for data analysis?
Answer: A Pivot Table is a statistics tool that condenses and reorganizes selected columns and rows of data to produce reports. It allows you to analyze data from different perspectives without modifying the original dataset. Pivot Tables help summarize large datasets and deliver dynamic insights through customizable cross-tabulations.
Q5. What is the VLOOKUP function, and how is it used in data analysis?
Answer: VLOOKUP is a function that allows you to search across multiple columns. The syntax is =VLOOKUP(lookup_value, table_array, col_index_num, [range_lookup]), where "lookup_value" is your search criteria, "table_array" is the range of cells being searched, "col_index_num" is the column number containing the return value, and "range_lookup" determines whether to find an approximate match.
Q6. What is the difference between SUMIF and AVERAGEIF functions?
Answer: SUMIF adds values in a range that meet a specified condition. Its syntax is =SUMIF(range, criteria, [sum_range]). AVERAGEIF calculates the average of values in a range that meet a specified condition. Its syntax is =AVERAGEIF(range, criteria, [average_range]). Both functions are valuable for conditional calculations in data analysis.